データ型/データ構造
以下のサイトを参考にさせて頂いています。
データ型
| データの型 | 説明 | 定数の例 |
|---|---|---|
integer(numeric) | 整数型 | 1, -1, 20300, ... |
double(numeric) | 実数型(整数も含む) | 3.1415, -0.001, 125.00012, 1, 1e-10, ... |
complex | 複素数型 | 1i, 1 - 4.5i, 3+0i, complex(re=a,im=b), ... |
character | 文字型 | "A", "2014/10/14", "", ... |
logical | 論理型 | TRUE, FALSE, T, F, NA, ... |
データ構造
vector
matrix
array
list
data.frame
factor
iris
演算子(Operator)
この項目の表は以下から抜粋しています。

算術演算子(arithmetic operators)
| Operator | Description | Example Code | Result/ Output |
|---|---|---|---|
| + | Addition | x + y | [1] 7 |
| – | Subtraction | x – y | [1] -3 |
| * | Multiplication | x * y | [1] 10 |
| / | Division | x / y | [1] 0.4 |
| %% | Modulus (returns the remainder after division) | y %% x | [1] 1 |
| %/% | Integer division (returns an integer value after division) | y%/% x | [1] 2 |
| ^ | Exponent | y ^ x | [1]25 |
関係演算子(Relational operators)
| Operator | Description | Example Code | Result/Output |
|---|---|---|---|
| < | Less than | x < y | [1] TRUE |
| > | Greater than | x > y | [1] FALSE |
| <= | Less than or equal to | x < = 2 | [1] TRUE |
| >= | Greater than or equal to | y >= 10 | [1] FALSE |
| == | Equal to | y == 5 | [1] TRUE |
| != | Not equal to | x != 2 | [1] FALSE |
論理演算子(Logical operators)
| Operator | Description | comment |
|---|---|---|
| & | Element-wise logical AND | vectorの時は、vector内の要素全てを対象とする。(EX.) x <- c(3,5,7), y <-x(2,4,6)の時、x < 5 & y <5の結果は、TRUE FALSE FALSE |
| && | Logical AND | vectorの時は、vector内の初めの値のみを対象とする。(EX.) x <- c(3,5,7), y <-x(2,4,6)の時、x < 5 & y <5の結果は、TRUE |
| | | Element-wise logical OR | 同上 |
| || | Logical OR | 同上 |
| ! | Logical NOT |
代入演算子(Assignment operators)
| Operator | Description | Example Code (after the sample code below, typing x will generate the output in the next column) | Result/ Output |
|---|---|---|---|
| <- | Leftwards assignment | x <- 2 | [1] 2 |
| <<- | Leftwards assignment | x <<- 7 | [1] 7 |
| = | Leftwards assignment | x = 9 | [1] 9 |
| -> | Rightwards assignment | 11 -> x | [1] 11 |
| ->> | Rightwards assignment | 21 ->> x | [1] 21 |
base
Rにデフォルトで含まれているパッケージ
コンフィグ関係
言語変更
Sys.setenv(LANG = “en”)
関数(function)の説明
browseVignettes(“function名”)
パッケージインストール
install.packages(“package名”)
インストール済みのパッケージ一覧表示
installed.packages()
パッケージの有効化
library(“package名”)
作業フォルダ(current directory(cd))の移動
setwd(“移動先のファイルリンク(現在の作業場所は含まない)”)
EX.) 現在、Project/にて作業→Project/Course 7/Week 3に移動。
setwd(“Course 7/Week 3”)
基本的な計算
最大値、最小値
最大値: MAX(表名$列名)
最小値: MIN(表名$列名)
表関連
表の表示 (console内ではなく、別タブとして)
View(“表名”)
表の詳細を文字形式で表示(各列のデータタイプ、データ数、データ一覧)
str(“表名”)
表の名前の一覧を表示
colnames(“表名”)
統計関連
ランダムな値の抽出
sample()
# 1から5の数列、my_vecから3つの数値をランダムで抽出

[INPUT]
my_vec <- 1:5
sample(my_vec, size = 3)

[OUTPUT]
[1] 2 3 5
tidyverse
Rで表形式のデータ処理・解析をするためのパッケージ
正確にはtidyverseは以下のパッケージをまとめたパッケージ集。
ggplot2: グラフ描画パッケージ
dplyr: データ操作パッケージ
tidyr: tidy dataを作るためのパッケージ
readr: データファイル読み込みパッケージ
purrr: 繰り返し計算を行うためのツール
tibble: tidyverseの世界で使うデータ形式。データフレームの一種
stringr: 文字列操作ライブラリ
forcats: ファクタ(因子)操作ライブラリ
http://bcl.sci.yamaguchi-u.ac.jp/~jun/notebook/r/tidyverse/
dplyr
特定の条件を満たす行の抽出 (SQLのwhereと同じ)
filter(“対象の表”, “列名と条件(ex. dose == 0.5)”)
表の並び順入れ替え (SQLのorder byと同じ)
arrange(表名, 並びの基準とする列名) #small -> large = Ascending
arrange(表名, -並びの基準とする列名) #large -> small = Descending
指定した列のみの抽出 (SQLのselectと同じ)
select(“表名”, “列名1”, “列名2”, “列名3”, …)
EX.1) select(bookings_df, adr, adults) #adr, adults列のみを抽出
EX.2) select(bookings_df, -adults) #adults列以外のすべての列を抽出。
列の追加
mutate(“表名”, “新表名と条件( ex. carat_2=carat*100)”)
表の先頭6列のみ表示
head(“表名”)
列名の変更
rename(新column名 = 旧column名)
列名のupper/lower caseの変更
rename_with(“表名”, “tolower”) #全てのcolumn名をlower caseに
rename_with(“表名”, “toupper”) #全てのcolumn名をupper caseに
rename_with(“表名”, “toupper”, start_with(“文字”)) #column名が特定の文字から始まる全てのcolumn名をupper caseに
指定した列の要素ごと(distinct)の値を集計する (SQLのgroup byと同じ)
表名 %>% group_by(列名) %>% summarise(アクション)
# penguinsテーブルのisland列の各要素に対して、NA値を省いた、bill_length_mmの平均値を求める。求めた値をmean_bill_length_mm列として出力する

[INPUT]
penguins %>% group_by(island) %>%
  drop_na() %>%
  summarize(mean_bill_length_mm = mean(bill_length_mm))

[OUTPUT]
  island    mean_bill_length_mm
  <fct>                   <dbl>
1 Biscoe                   45.2
2 Dream                    44.2
3 Torgersen                39.0
group_by対象の列は,で区切って複数選択可能。summarizeのアクションも同様に複数実行可能。
列の結合
表名 %>%
select(“既存の列1”, “既存の列2”, …) %>%
unite(新しい列名, c(“既存の列1”, “既存の列2”, …), sep = “結合データの間に入れる文字や記号”)
#bookings_dfのarrival_date_year列と、arrival_date_month列を組み合わせて、arrival_month_year列を作成する。結合の際、間に半角スペースを入れる。

[INPUT]
bookings_df %>%
 select(arrival_date_year, arrival_date_month) %>%
 unite(arrival_month_year, c("arrival_date_month", "arrival_date_year"), sep = " ")

[OUTPUT]
arrival_month_year
   <chr>
 1 July 2015
 2 July 2015
 3 July 2015
 4 July 2015
 5 July 2015
 6 July 2015
 7 July 2015
 8 July 2015
 9 July 2015
10 July 2015
列の分離
separate(表名, 分離する列名, into = c(‘分離後の列1’, ‘分離後の列2’), sep = “分離する条件”)
#employeeテーブルのname列を、半角スペースを目印に、first_name列とlast_name列に分ける。

[INPUT]
separate(employee, name, into = c('first_name', 'last_name'), sep = " ")

[OUTPUT]
   first_name  last_name
1        John     Mendes
2         Rob    Stewart
3      Rachel Abrahamson
4     Christy    Hickman
5     Johnson     Harper
6     Candace     Miller
7     Carlson      Landy
8       Pansy     Jordan
9      Darius      Berry
10    Claudia     Garcia
ggplot
data.frame型のデータの図を作成するパッケージ。cheetsheet
グラフを書くdata.frameの指定、グラフのX軸、Y軸の設定
ggplot(表名, aes(グラフの設定))
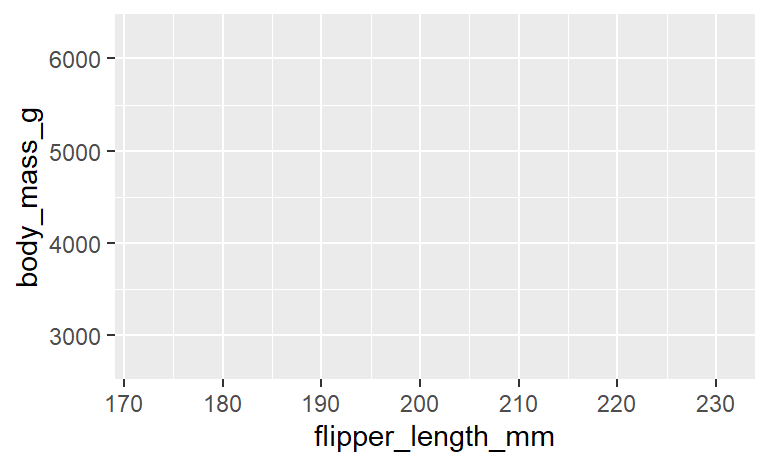
# penguins表から、X軸=flipper_length_mm、 y軸=body_mass_gの枠を作成
# data = , mapping = という記述は省くケースもある

[INPUT]
ggplot(data = penguins, mapping = aes(x = flipper_length_mm, y = body_mass_g))

[OUTPUT]
グラフのタイプを選ぶ
geom_グラフタイプ() #例えばgeom_point()であれば分散図を生成する。
グラフタイプの一覧は以下を参照:

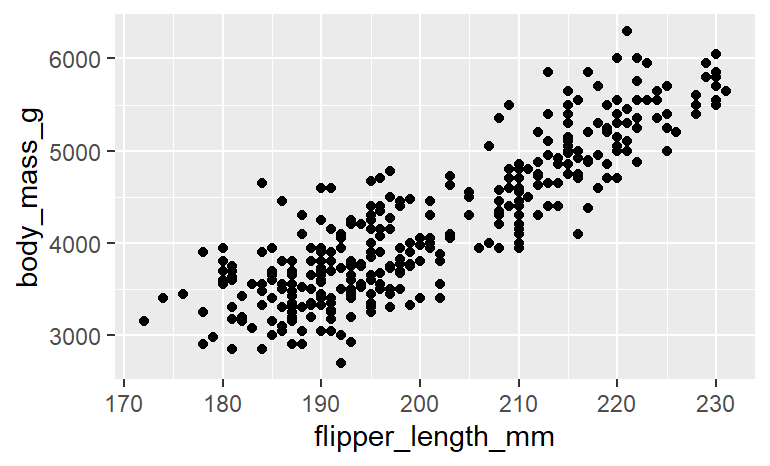
# penguins表から、X軸=flipper_length_mm、 y軸=body_mass_gの分散図を作成
# data = , mapping = という記述は省くケースもある

[INPUT(pattern 1)]
ggplot(data = penguins, mapping = aes(x = flipper_length_mm, y = body_mass_g)) + geom_point()

[INPUT(pattern 2)]
ggplot(data = penguins) + geom_point(mapping = aes(x = flipper_length_mm, y = body_mass_g))

[OUTPUT]
グラフの色、大きさ、形などを編集する
要素別に反映:ggplot(表名, mapping = aes(x軸指定, y軸指定, 様々なグラフィック))
表全てに反映:ggplot(表名, mapping = aes(x軸指定, y軸指定)) + geom_グラフタイプ(様々なグラフィック)
- color
- size
- alpha: 色の濃淡をつける
- linetype
- fill: geom_barなどで要素ごとに色分け
# scatterplot
ggplot(data = linelist,   # set data
       mapping = aes(     # map aesthetics to column values
         x = age,           # map x-axis to age
         y = wt_kg,         # map y-axis to weight
         color = age,       # map color to age
         size = age))+      # map size to age
  geom_point(             # display data as points
    shape = "diamond",      # points display as diamonds
alpha = 0.3) # point transparency at 30%グラフを要素ごとに分割する
単独要素: facet_wrap(~要素名)
複数要素: facet_grid(要素名1~要素名2)
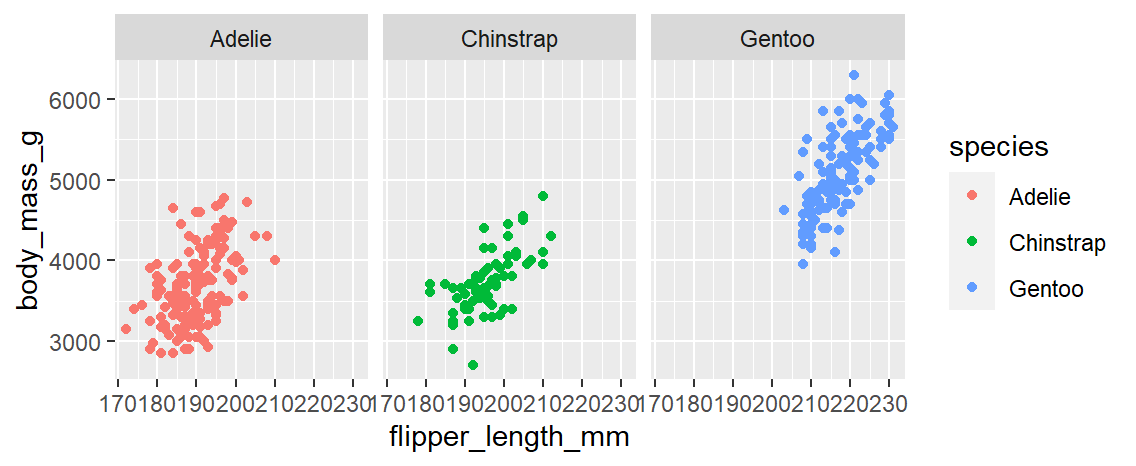
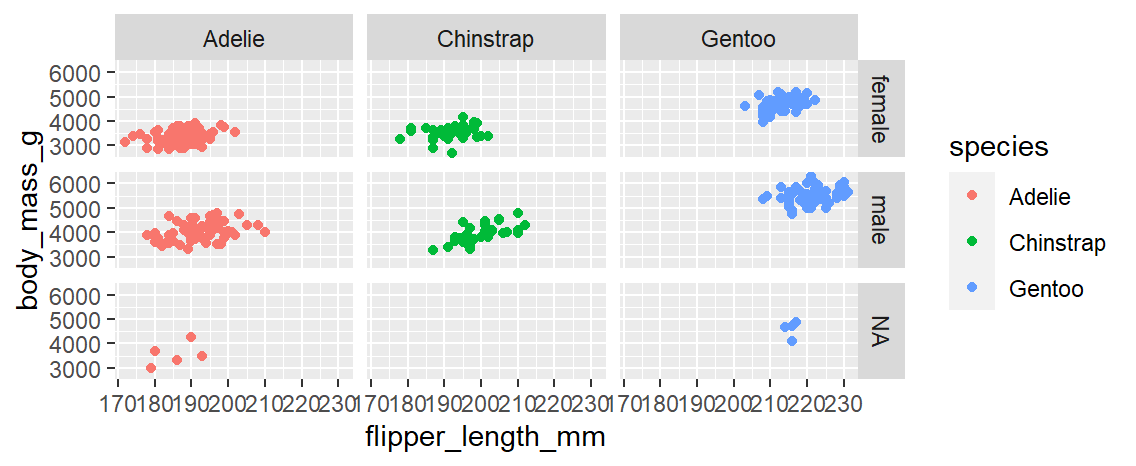
# penguins表から、X軸=flipper_length_mm、 y軸=body_mass_gの枠を作成
# INPUT1 → species毎にグラフを分割
# INPUT2 → sex x species毎にグラフを分割
[Original dataframe]
species sex flipper_length_mm body_mass_g
<fct> <fct> <int> <int>
1 Adelie male 181 3750
2 Adelie female 186 3800
3 Adelie female 195 3250
4 Adelie NA NA NA
5 Adelie female 193 3450
6 Adelie male 190 3650
7 Adelie female 181 3625
. ... ... ... ...
. ... ... ... ...
[INPUT1] facet_wrap
ggplot(data = penguins, mapping = aes(x = flipper_length_mm, y = body_mass_g, color = species))+
geom_point() +
facet_wrap(~species)
[OUTPUT1]
 [INPUT2] facet_grid
ggplot(data = penguins, mapping = aes(x = flipper_length_mm, y = body_mass_g, color = species))+
geom_point() +
facet_grid(sex~species)
[OUTPUT2]
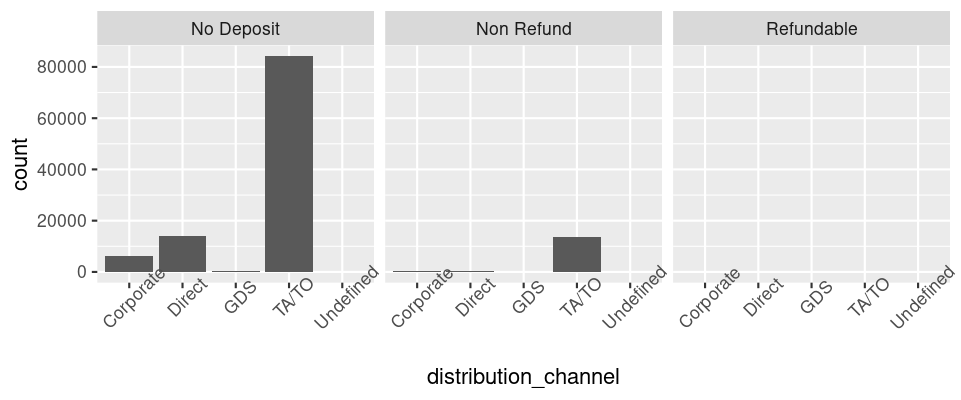
グラフの見た目(theme)を変える
theme(変更する対象 = element_変更項目(変更の内容)
[変更前]
ggplot(data = hotel_bookings) +
  geom_bar(mapping = aes(x = distribution_channel)) +
  facet_wrap(~deposit_type)


[変更後]
ggplot(data = hotel_bookings) +
  geom_bar(mapping = aes(x = distribution_channel)) +
  facet_wrap(~deposit_type) +
  theme(axis.text.x = element_text(angle = 45))
タイトル、サブタイトル、注釈などを足す。
labs(編集内容)
# タイトルの追加
ggplot(.....) +
  geom_xxxx(.....) +
  labs(title="タイトル名")

# サブタイトルの追加
ggplot(.....) +
  geom_xxxx(.....) +
  labs(subtitle="Subタイトル名")

# 注釈の追加
ggplot(.....) +
  geom_xxxx(.....) +
  labs(caption="注釈")
グラフ内にコメントを付け足す
annotate(編集内容)
readr
エクセルの特定のシートを呼び出す
read_excel(“ファイル名”, sheet = “シート名”)
例) read_excel(readxl_example(“type-me.xlsx”), sheet = “numeric_coercion”)
tidyr
表の縦横の入れ替え
基本: pivot_longer(表名, 対象の列A, names_to = ‘列Aの列名を示す新列名’, values_to = ‘列Aの内容を示す列名’
複数列組み合わせ: pivot_longer(表名, 対象の列A:対象の列B, names_to = ‘列A&列Bの列名を示す新列名’, values_to = ‘列A&列Bの内容を示す列名’)
# table表の、first_name列, last_name列を縦長に並び替えて、name_category列, names列と名前を付ける。

[table表の内容]
  id first_name last_name age
1  1        Ryu    Tanaka  29
2  2       Yuko    Tanaka  31
3  3          A    Street  55
4  4          B       Cat  91
5  5          C     Dance  10

[INPUT]
table_v2 <- pivot_longer(table, first_name, names_to = 'name_category', values_to = 'names')
select(table_v2, id, name_category, names, age)

[OUTPUT]
      id name_category names    age
   <int> <chr>         <chr>  <dbl>
 1     1 first_name    Ryu       29
 2     1 last_name     Tanaka    29
 3     2 first_name    Yuko      31
 4     2 last_name     Tanaka    31
 5     3 first_name    A         55
 6     3 last_name     Street    55
 7     4 first_name    B         91
 8     4 last_name     Cat       91
 9     5 first_name    C         10
10     5 last_name     Dance     10
データクリーニング関連
here
skimr
表の統計的情報を含む詳細を表示する(col/row num, data type, missing value, mean, sd, etc.)
skim(“表名”)
janitor
列名にあるスペースの処理(アンダースコアにしたり、スペースを無くしたり)
clean_names(表名, “スペースの処理方法”)
スペースの処理方法:
"snake"produces snake_case"lower_camel"or"small_camel"produces lowerCamel"upper_camel"or"big_camel"produces UpperCamel"screaming_snake"or"all_caps"produces ALL_CAPS"lower_upper"produces lowerUPPER"upper_lower"produces UPPERlowerold_janitor: legacy compatibility option to pre
モンテカルロ・シミュレーションの環境構築や計算
SimDesign
予測値のバイアスの計算
バイアスは、平均的な予測値と真の値からの距離。つまり、真の値から平均値(予測値)を引いた値。この予測誤差は、モデルの仮定に誤りがあることから生じる。

bias(真の値(vector)、予測値(vector))
self memo(QA)
dyplrとggplotを一つのコードchunkで同時に使えますか?
使えます。以下サンプルコード。
#https://rladiessydney.org/courses/ryouwithme/03-vizwhiz-1/#1-4-putting-it-all-together-dplyr-ggplot

data %>%
    filter(variable1 == "DS") %>%
    ggplot(aes(x = weight, y = variable2, colour = variable1)) +
    geom_point(alpha = 0.3,  position = position_jitter()) + stat_smooth(method = "lm")


コメント